Back to Tutorials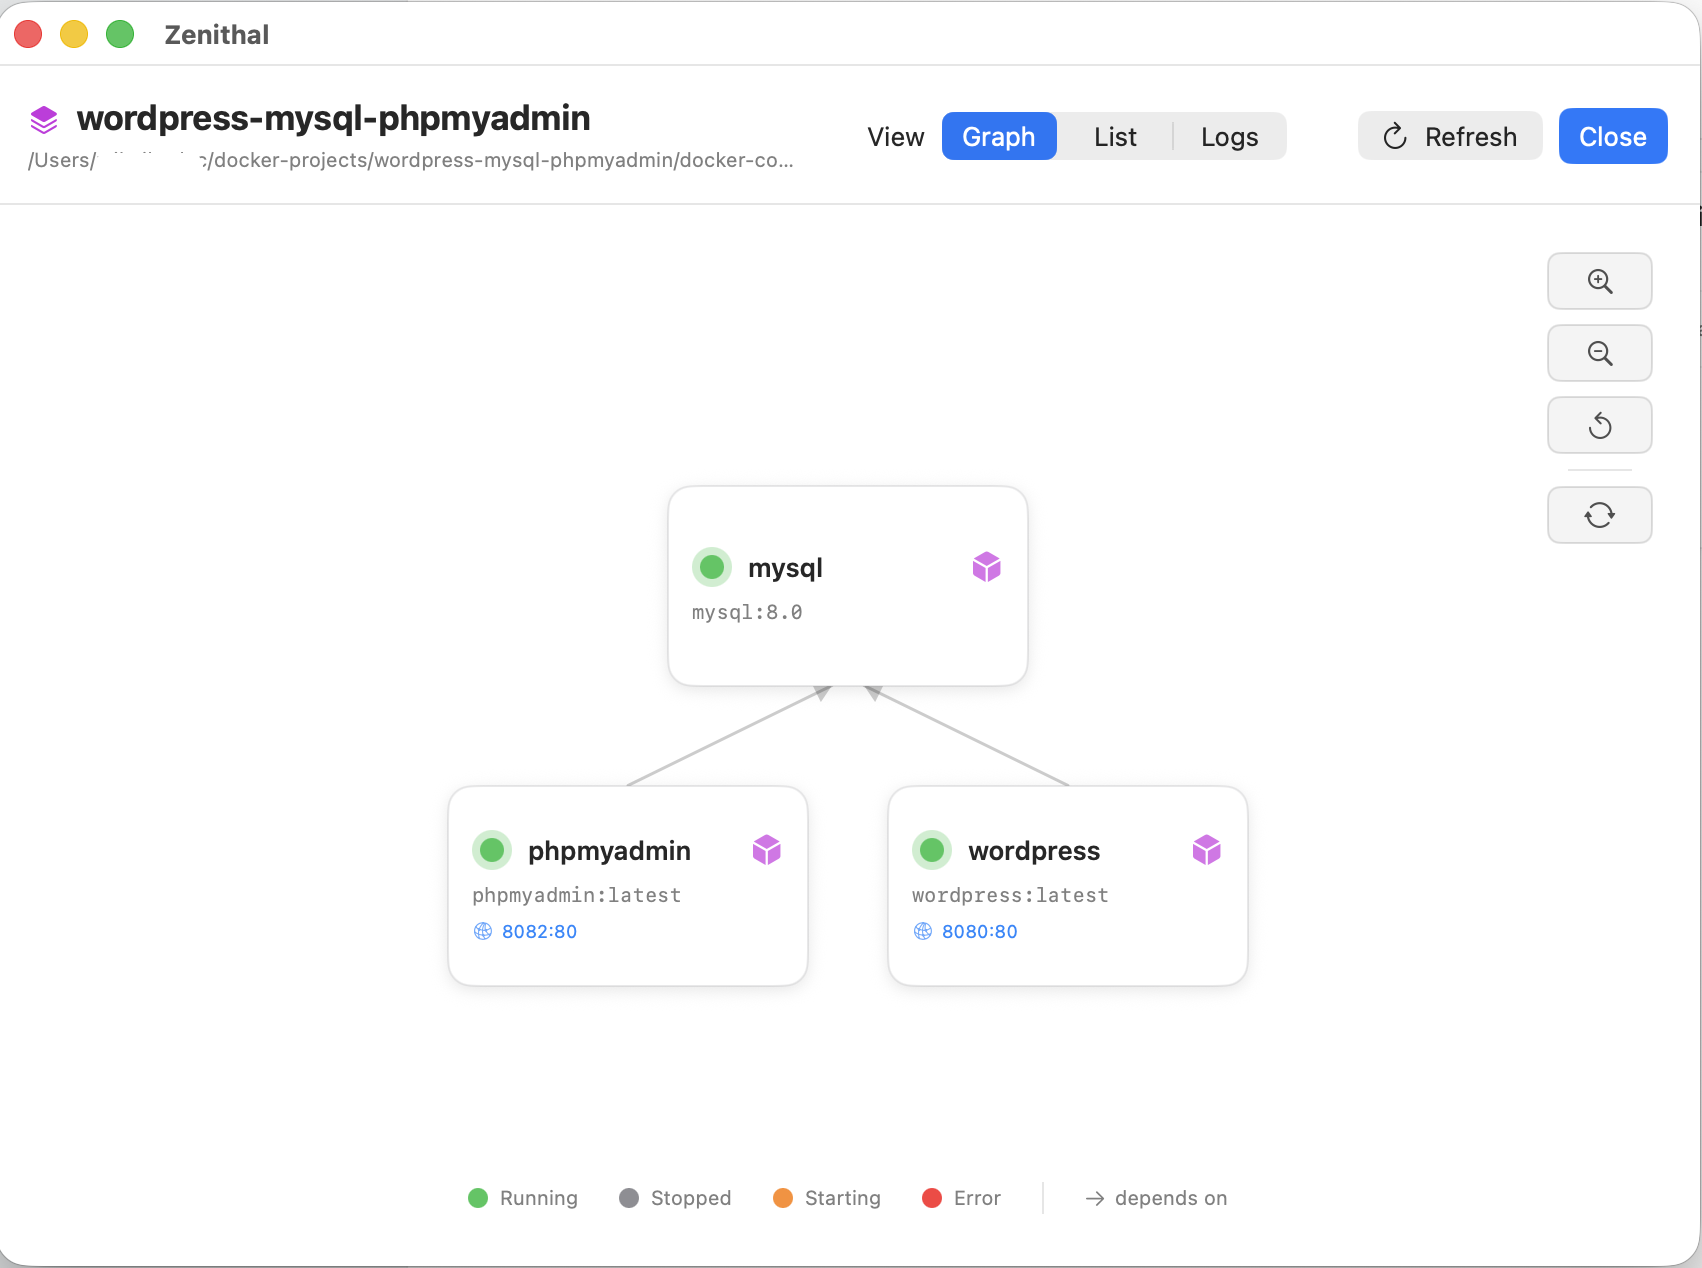
Compose Service Graph
Visualize service dependencies, check status at a glance, and perform quick actions from the graph view.
Prerequisites
- Docker is running
- A Compose project is open with at least two services
Explore the Service Graph
- Click Compose in the sidebar
- Select a running project (e.g., the WordPress stack)
- Click the Graph tab in the segmented picker
- The service graph renders with:
- Each service as a colored node (card) showing the service name and status badge
- Dependency arrows connecting services (polyline routing with straight segments)
- A topological layout - services with no dependencies appear on the left, dependent services on the right
Read the Graph
- Arrowspoint from dependent → dependency (e.g.,
wordpress→mysqlmeans WordPress depends on MySQL) - Green badges = running, Red badges = stopped, Yellow badges = starting
- Node position reflects the dependency hierarchy
Zoom and Pan
- Use the scroll wheel (or pinch gesture) to zoom in/out
- Click and drag the background to pan the view
- The graph re-renders arrows on resize to maintain proper routing
Quick Actions
- Hover over a service node to see quick action buttons:
- Terminal - opens a shell in the service container
- Logs - opens the log viewer for that service
- Start / Stop / Restart
- Click a service node to select it and highlight its dependency connections
Example Graph Layout
For a WordPress stack with three services:
What You'll See
- Service nodes are arranged in a left-to-right topological layout
- Dependency arrows use polyline routing (straight horizontal and vertical segments) - not Bezier curves
- Arrows automatically avoid intersecting with other service nodes
- The graph updates in real-time as service status changes
- Zoom level persists during the session
Tips
- The graph is most useful for projects with complex dependency chains - for simple 1-2 service projects, the list view may be sufficient
- Polyline arrows were chosen over Bezier curves because they're easier to follow and don't intersect node shapes
- If the graph looks cluttered, zoom out or resize the window - arrows re-route automatically
- Services without dependencies appear on the leftmost column
- The graph view is read-only for layout - you cannot reposition nodes manually (layout is computed from dependencies)