Dependency Graph
Visualize and explore the relationships between your packages with an interactive dependency graph.
Opening the Dependency Graph
There are several ways to open the dependency graph:
- Press
Cmd+Shift+Gfrom anywhere in the app - Click View → Dependency Graph in the menu bar
- Click the Dependencies tab in the package details panel
Understanding the Graph
The dependency graph shows how packages relate to each other:
- Nodes - Each circle represents a package
- Edges - Lines connect packages to their dependencies
- Colors - Different colors indicate package types and status
- Size - Larger nodes have more dependents
Node Colors
| Color | Meaning |
|---|---|
| Blue | Installed formula |
| Purple | Installed cask |
| Amber | Selected/focused package |
| Gray | Not installed dependency |
Interacting with the Graph
Navigation
- Pan - Click and drag on empty space to move the view
- Zoom - Use scroll wheel or pinch gesture to zoom in/out
- Reset View - Double-click empty space to reset zoom and position
Selecting Packages
- Click a node - Select that package and highlight its connections
- Double-click a node - Open the package details in the main view
- Hover over a node - See package name and version tooltip
Graph Modes
Switch between different visualization modes:
Dependencies View
Shows what packages the selected package depends on:
- Direct dependencies are connected with solid lines
- Transitive dependencies are shown with dashed lines
- Depth can be controlled with the slider
Dependents View
Shows what packages depend on the selected package:
- Useful for understanding impact before uninstalling
- Shows why a package was installed as a dependency
Full Graph View
Shows all installed packages and their relationships:
- Great for understanding your overall system
- Can be filtered by package type
- Performance optimized for large graphs
Tip: Use the search box in the graph view to quickly find and focus on specific packages.
Graph Controls
| Control | Description |
|---|---|
| Depth Slider | Control how many levels of dependencies to show (1-5) |
| Layout | Switch between force-directed, hierarchical, or radial layouts |
| Filter | Show only formulae, casks, or both |
| Export | Save the graph as PNG or SVG image |
Layout Options
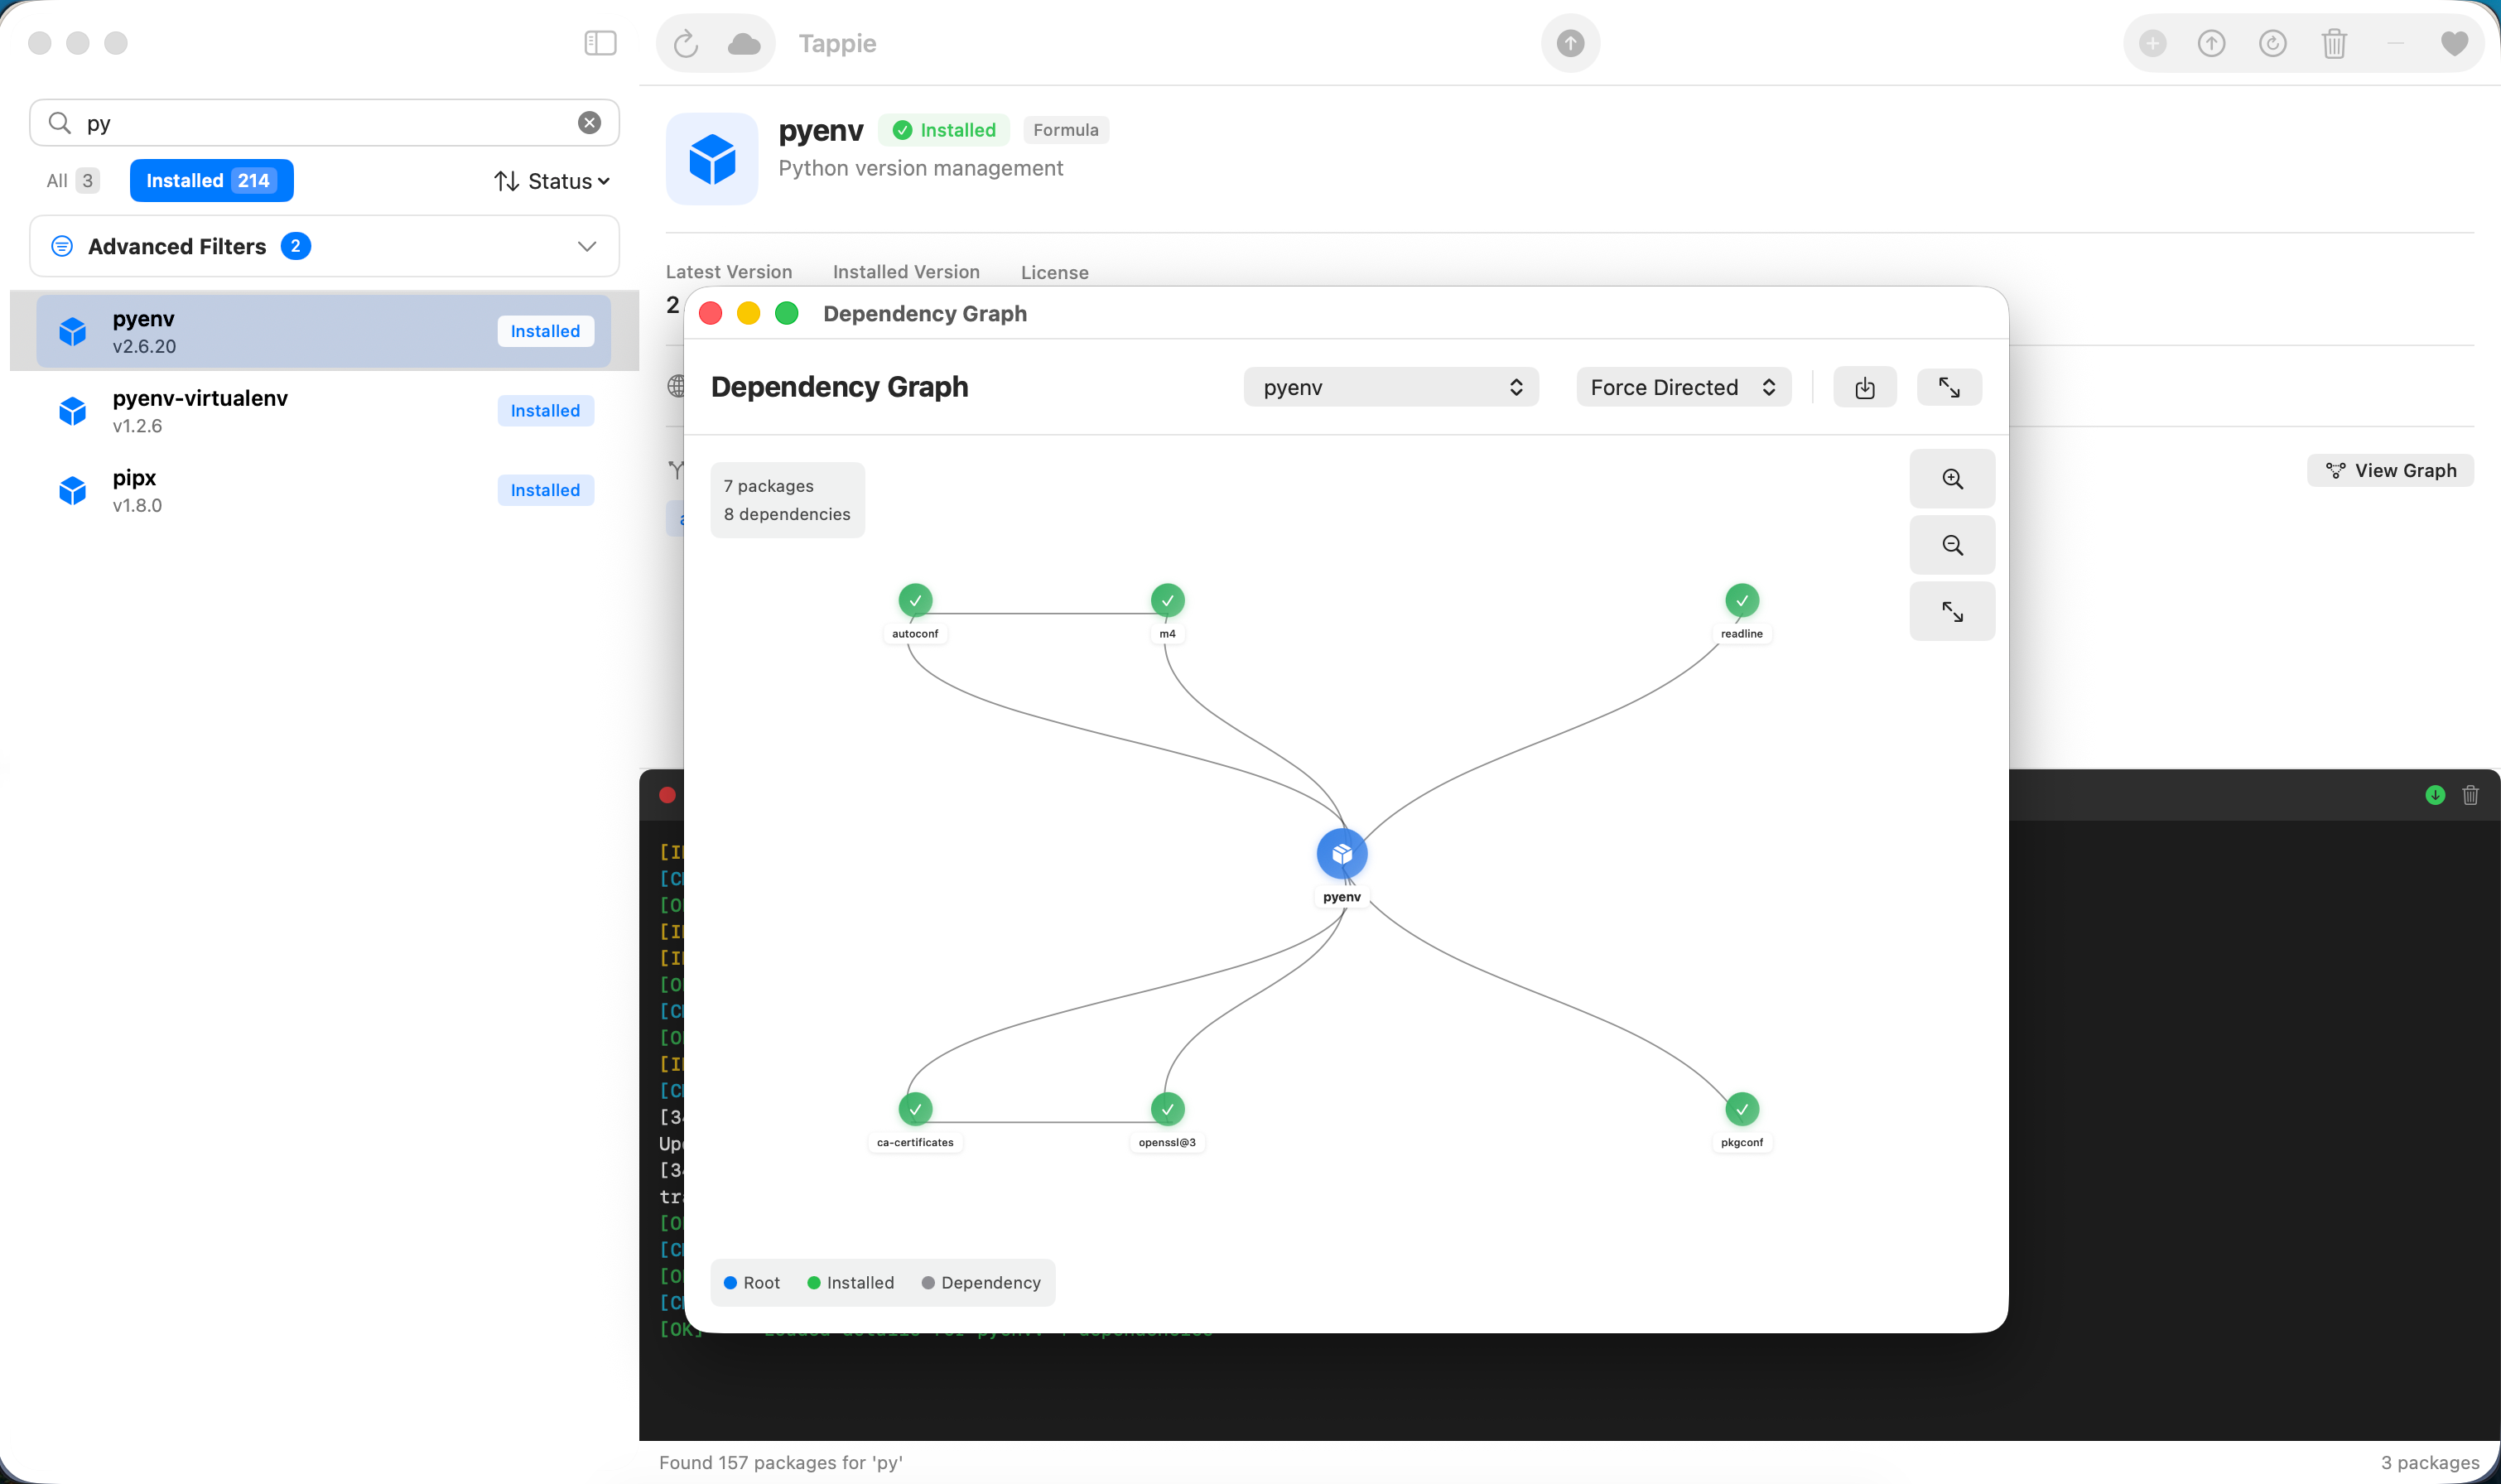
Force-Directed
Default layout where connected packages attract each other:
- Natural clustering of related packages
- Good for exploring relationships
- Nodes can be dragged to rearrange
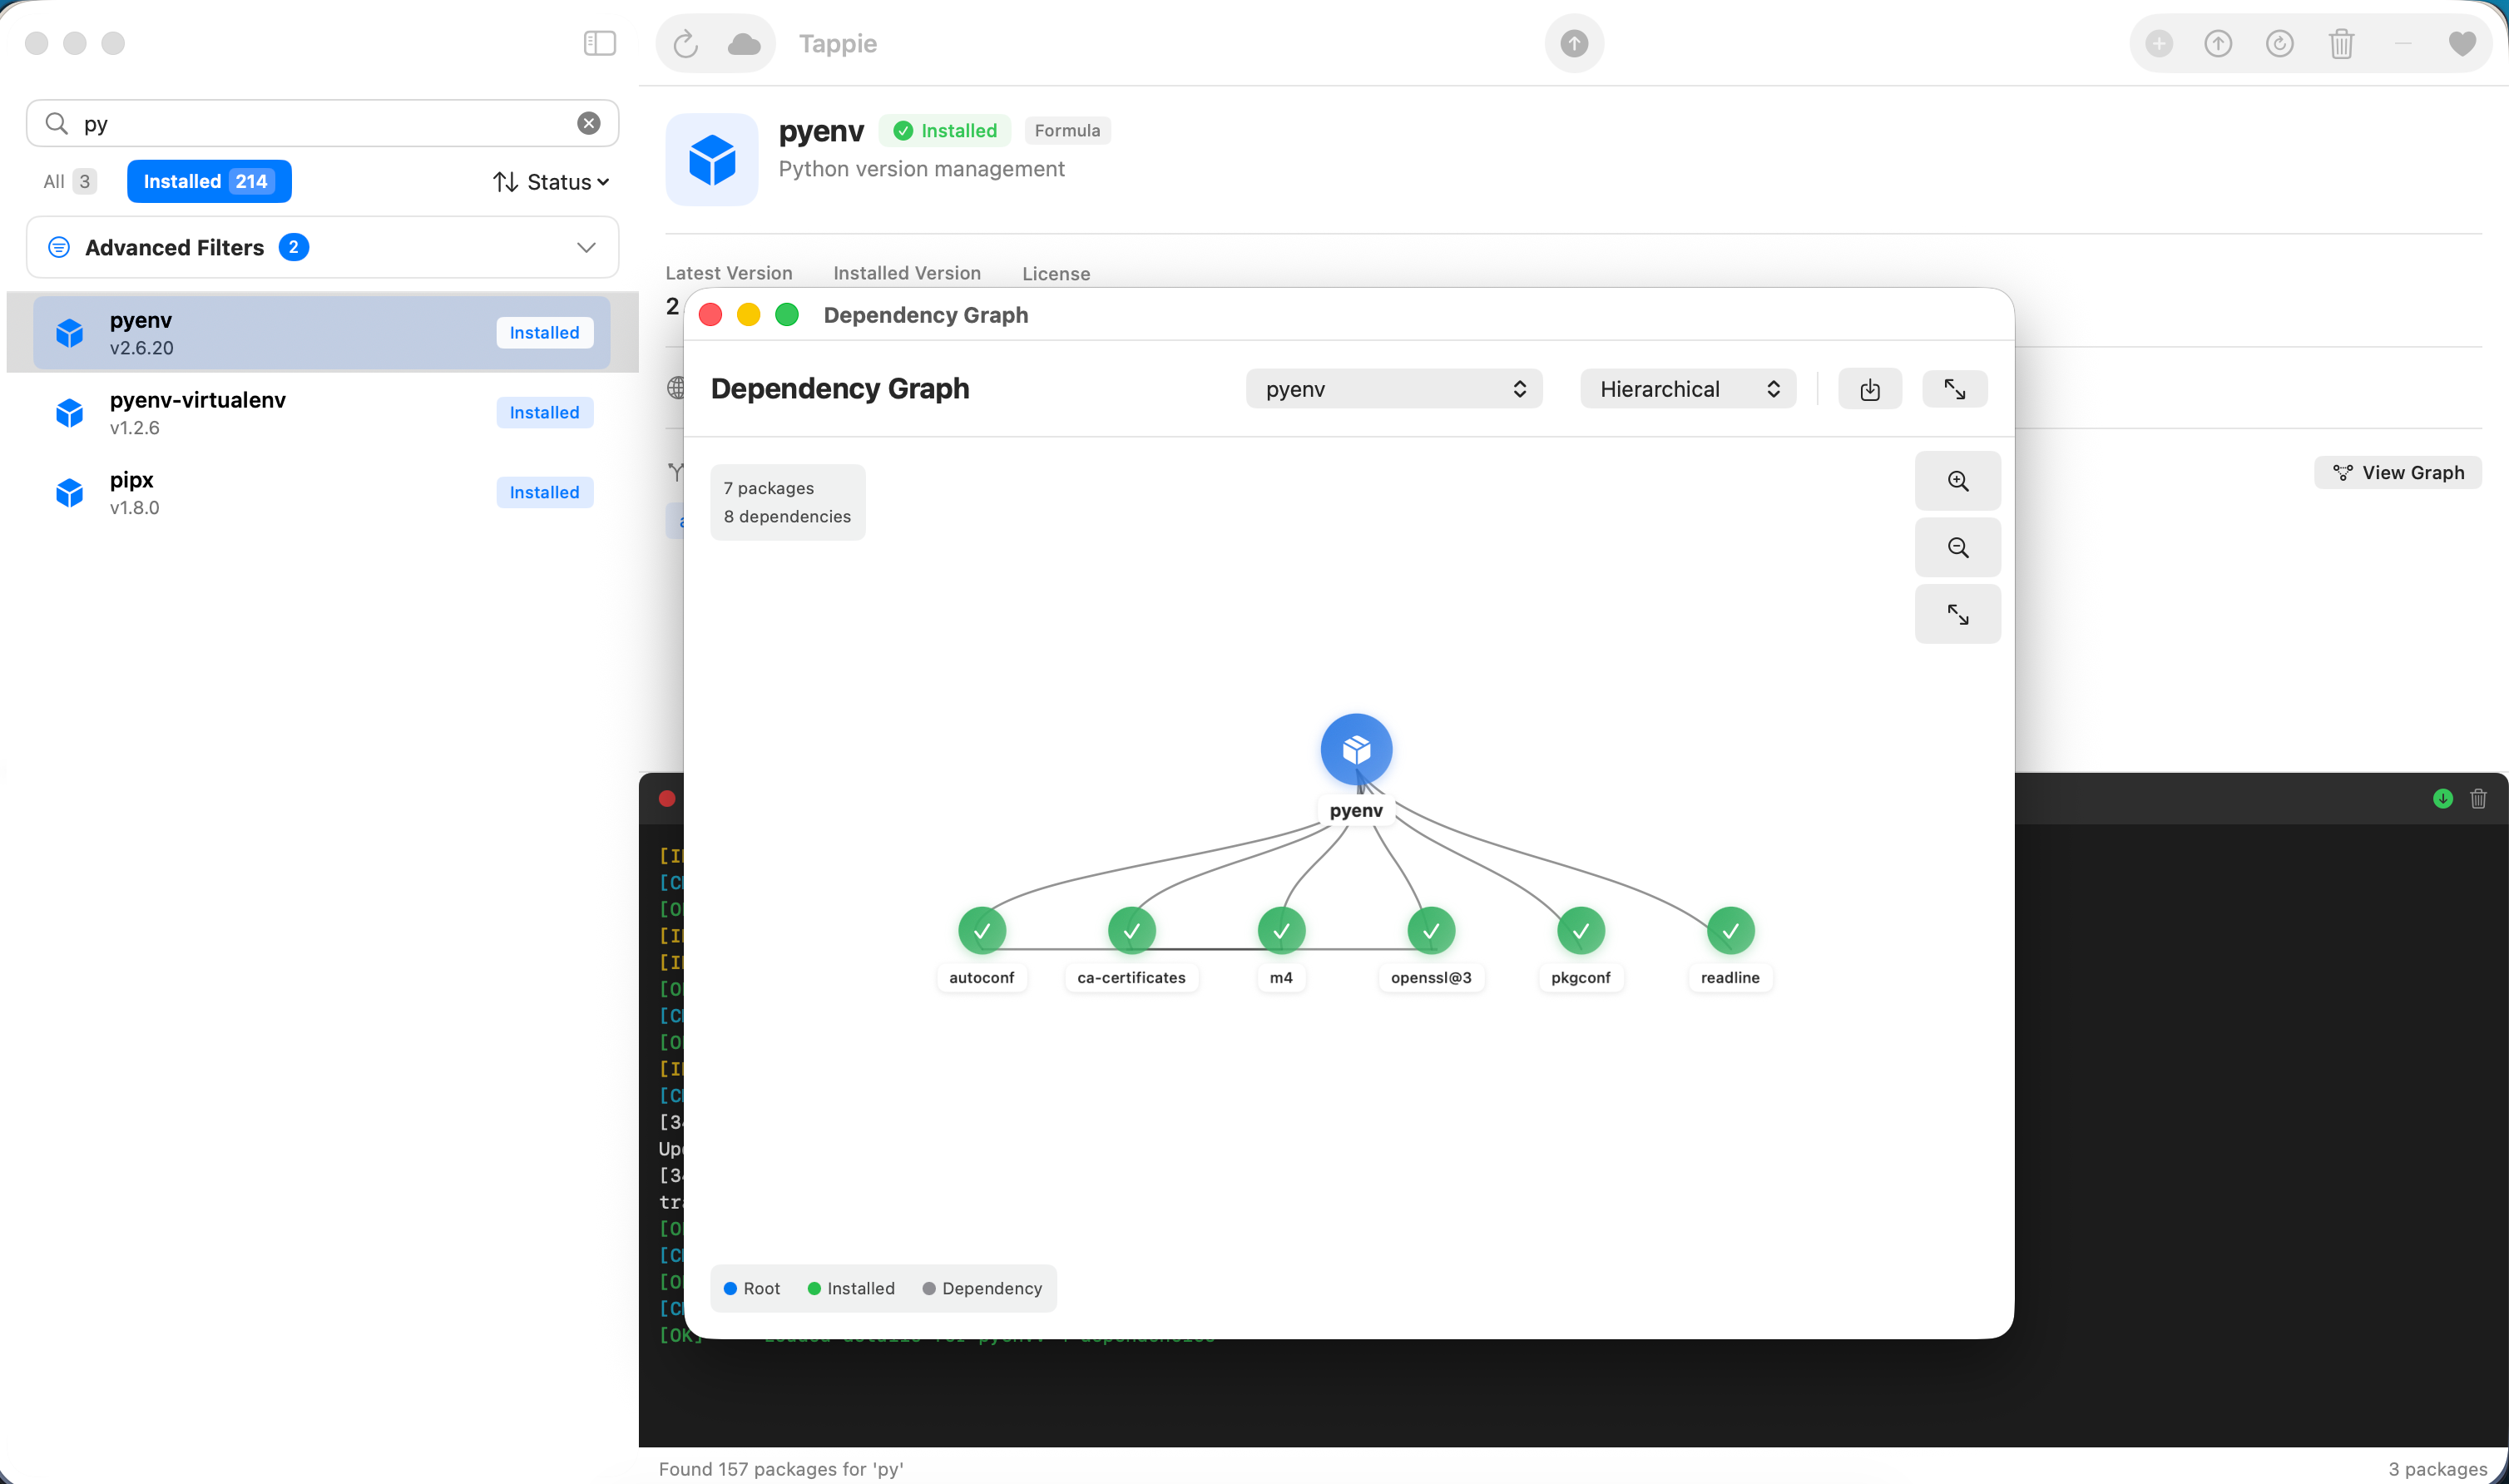
Hierarchical
Tree-like layout showing dependency levels:
- Clear visualization of dependency depth
- Root packages at top, dependencies below
- Best for understanding dependency chains
Radial
Circular layout with selected package at center:
- Dependencies radiate outward
- Great for focused exploration
- Compact view for many dependencies
Use Cases
Before Uninstalling
Check what depends on a package before removing it:
- Select the package you want to uninstall
- Switch to Dependents view
- Review which packages will be affected
Understanding Installation Size
See all transitive dependencies that will be installed:
- Find a package you want to install
- View its dependency graph
- Count total packages that will be added
Finding Orphaned Packages
Identify packages with no dependents:
- Open the full graph view
- Look for isolated nodes
- These may be candidates for cleanup